

|
|
qmsm_shape_editor -i image.png -p points.pts [-c curves.crvs] [-s shape_model.msm] [-ct 0] [-cc curve_cols.ccol]where curves.crvs is a curves file and shape_model.msm contains an msm_shape_model object (for instance, built by the msm_build_shape_model tool.
qmsm_shape_editor -l image_list.txt [-c curves.crvs] [-s shape_model.msm] [-pi pts_info.txt] [-ct 2] [-bs 1.2]where image_list.txt is a text parameter file in the following format:
// Define directories containing image and points files
image_dir: images/
points_dir: points/

// Optional: Directory containing other points to be displayed but not changed.
guide_points_dir: ./guide_points/

// Optional notes file folder. When supplied text notes files saved here with names pointsfilename.txt
notes_dir: ./notes/


// Optional list of points which are frozen (and thus cannot be moved at all)
frozen_pts: { 0:30  37:47 }


images:
{
  example1.pts : example1.png
  example2.pts : example2.png
  example3.pts : example3.png
}
when this option is used (or such a list is loaded using the "File->Load Image List" option), the tool
records the list of images and points, and displays the first one.example1.pts Some information here example2.pts Some other information here. ...The text on the line after the points name will be recorded and displayed on the status bar at the bottom of the window when those points are read in.
import pandas as pd
import numpy as np

df=pd.read_csv("results.txt",delimiter=' ')
g_fit=df["global_qof"].to_numpy()
pts_name=df["pts_name"].to_numpy();

with open("pts_info.txt",'w') as f:
  for i in range(len(g_fit)):
    f.write(pts_name[i]+f" QoF: {g_fit[i]:.1f}\n")

print("Wrote pts_info.txt")
curves: {
  curve:  { name: Chin open: true indices: { 0:14 } }
  curve:  { name: LEyebrow open: false indices: { 15:20 } }
  curve:  { name: REyebrow open: false indices: { 21:26 } }
  curve:  { name: LEye open: false indices: { 27:30 } }
  curve:  { name: REye open: false indices: { 32:35 } }
  curve:  { name: Nose open: true indices: { 37:45 } }
  curve:  { name: Nostrils open: true indices: { 46 47 } }
  curve:  { name: OuterLips open: false indices: { 48:59 } }
  curve:  { name: TopLip open: true indices: { 48 60 61 62 54 } }
  curve:  { name: BottomLip open: true indices: { 54 63 64 65 48 } }
}
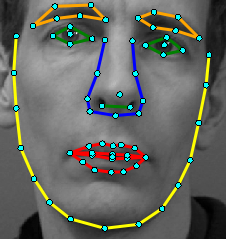
The curve colour file defines the colour to use for each curve:
// Colour associated with each curve (by curve name)
default_color: green
colors:
{
  Chin : yellow
  LEyebrow : orange
  REyebrow : orange
  Nose : #0000FF
  OuterLips : red
  TopLip : red
  BottomLip : red
}
The colour is either a name (defined by QColor) or a hexadecimal code, such as "#0000FF" in the above. |
Drag Mode | Click and drag to move viewport around |
 |
Select Mode | Press and drag to move a point. Rubber-band box to select groups. |
 |
Drag-Shape Mode | Click and drag a point to move it. All un-fixed points are dragged around to satisfy shape model constraints. |
 |
Equal Space Mode | Click on a point to equally space points on the curve through the point, limited by either the ends of the curve or fixed points. |