qmsm_hip_tool3
A tool for making geometric measurements from pelvic radiographs
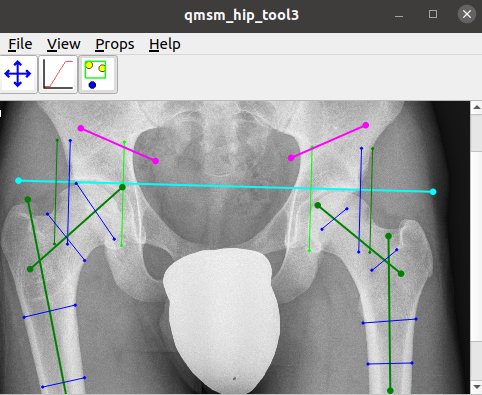 |
The tool enables the user to place various lines and markers on an
image in order to measure:
- Reimer's Migration Percentage
- The Acetabular Index
- The neck shaft angle
Instructions
Getting started
PLEASE NOTE THAT NO SPACES ARE ALLOWED IN THE PATH TO THE DIRECTORIES WHERE THE TOOL, IMAGES AND MEASUREMENT FILES ARE SAVED.
- Run the tool (for instance in Windows it might be in Manual_measurements_tool\_tool\qmsm_hip_tool3.exe)
- Maximise the application window.
- Load image list via "File>Open File List" [Manual_measurements_tool\image_list_test_5img.txt]
Measurements
- For any new image the measurement tool will be initialised at the centre of the image.
- Each individual line can then be moved by clicking on it with the left mouse button and keeping the button pressed while dragging it into position.
- The angle of a line can be changed by clicking on one of the end points with the left mouse button and keeping the button pressed while putting the line in position.
- The positions of the end points of the lines do not matter. It's only about placing the lines at the correct angle and position.
Measurement types
- Reimer's migration percentage: The dark green (lateral femoral head side), light green (medial femoral head side) and blue (Perkin’s line) lines are automatically placed perpendicular to the cyan line (Hilgenreiner's line).
- Acetabular index: The magenta lines are to define the acetabular angle.
- Neck-shaft angle: Both the blue lines and the blue end points can be moved into position. The dark green lines are mainly for visualisation of the axes. However, their length can be changed using the end points.
Saving
- Once all lines have been modified as required, pressing the right arrow on the keyboard will move to the next image in the list. Before doing so, there will be a dialogue to ask whether the points should be saved. This would need to be confirmed with "Save" as otherwise the measurement data for this image will be lost.
- All measurements will be written to Manual_measurements_tool\_measurements (as defined in the image list). There will be one graphics file (.pts) and one measurement file (.dat) for each image.
- One can also saved the points "manually" (i.e. without moving to the next image in the image list) using "File > Save Points". However, this way one would need to provide the name of the .pts file manually, which should be the same as in the image list. It is recommended to use the image list function to cycle through the images and make use of the saving option when moving to a different image.
- Note that when cycling through the images without changing the measurements then no saving dialogue will appear.
Display options
- One can use the mouse wheel to zoom in and out of the image.
- Once can change the contrast of the image by clicking on the top-left button with the red curve and then moving the mouse very slowly over the image while keeping the left mouse button pressed. The original image contrast can be restored by pressing S. Once the contrast has been adjusted accordingly, one needs to press the top-left button with the three dots before one can proceed with the measurements.
- Pressing G on the keyboard cycles through the graphics showing and hiding them. This may help to better visualise individual components.
Tim Cootes/Claudia Lindner 2021